
The Decoupling: tracking case divergence State by State
Omicron Cases are diverging from severe outcomes

Omicron has changed the implications of what a positive case of Covid means. More and more analysis has corroborated the fact that Omicron is less severe1 than the previous variants.
A recent paper from Case Western Reserve University2 found
“The 3-day risks from the Emergent Omicron cohort for ED visit was less than one-third of that for the Delta variant (4.55% vs 15.22%); for ICU admission, it was one third of that for the Delta variant (0.26% vs 0.78%); for mechanical ventilation, it was one-sixth of that for the Delta variant (0.07% vs 0.43%).”
Now that a few weeks have passed since the arrival of the most recent wave, we can observe this reduced severity by comparing the trends of cases over time with the trend of ICU cases.
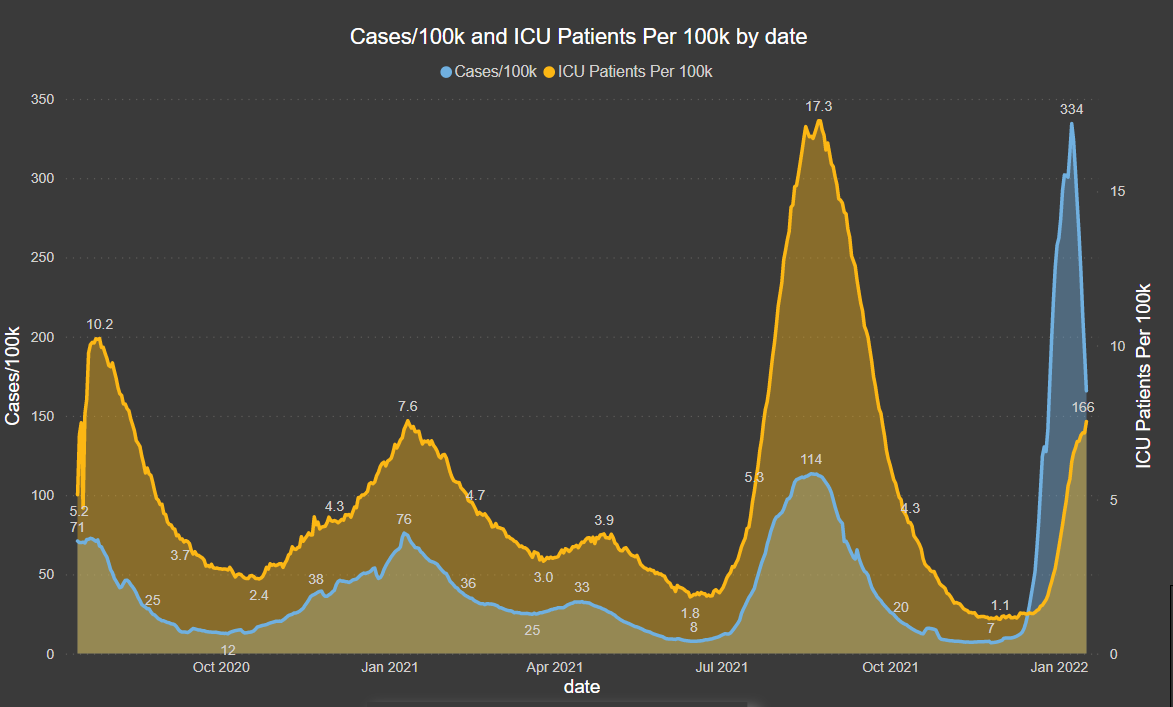
How to read this visual:
This is a dual-axis area chart.
The Yellow area is Covid Patients in ICU per 100,000 population, and the scale is on the right Y Axis. The Blue area is Positive PCR tests per 100,000 population, and the scale is on the left Y Axis.
As you can see for most of the pandemic, the proportion of ICU Covid cases tracked somewhat evenly with the overall case rate. However, something drastically changed around December 2021, where case rates skyrocketed to levels never seen before in the pandemic, due to the highly infectious nature of the Omicron SARS-COV2 variant. While this has certainly caused an increase in the overall number of hospitalizations, the proportion of these cases ending up in hospitalization has reduced drastically from what it used to be. The divergence appears where blue area overtakes the yellow.
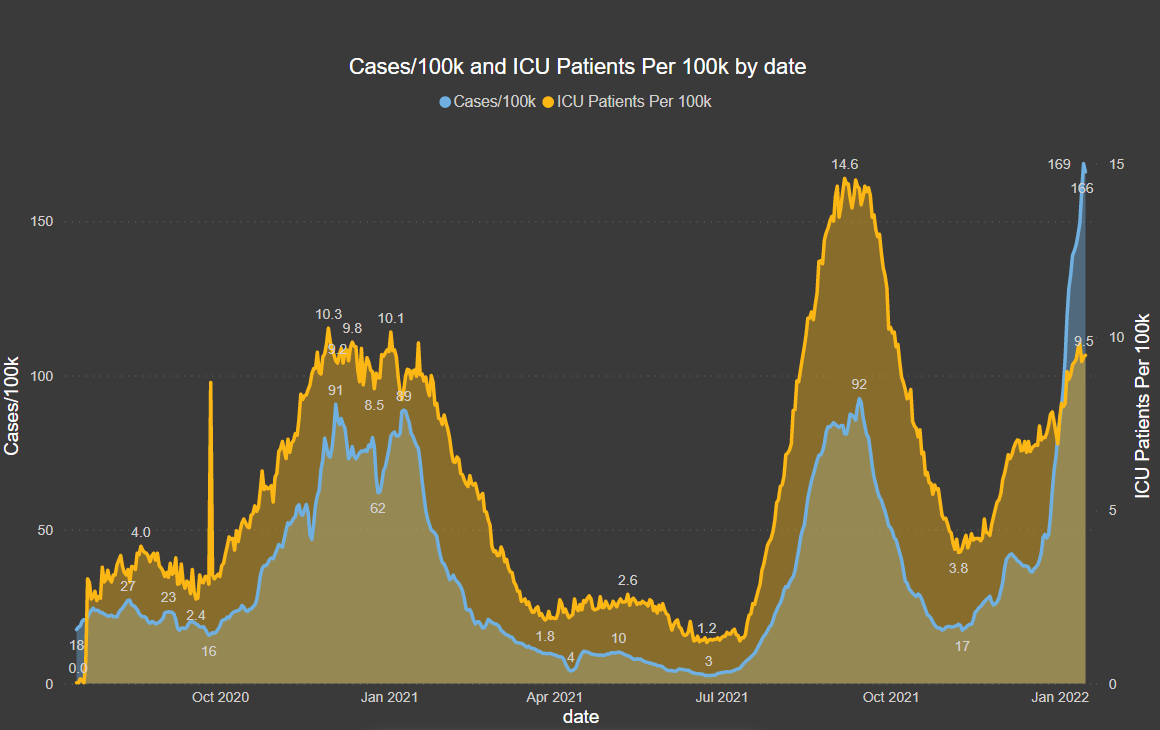
Here’s a sampling of the situation from different states throughout the country:
Arizona

Alabama

Kentucky
Paid Subscribers can access this tool and select their state to see the situation where they live.
Keep reading with a 7-day free trial
Subscribe to Relevant Data to keep reading this post and get 7 days of free access to the full post archives.