Adult vs. Pediatric SARS-COV2 Positive Inpatients by State
New Dashboard from a Subscriber Request
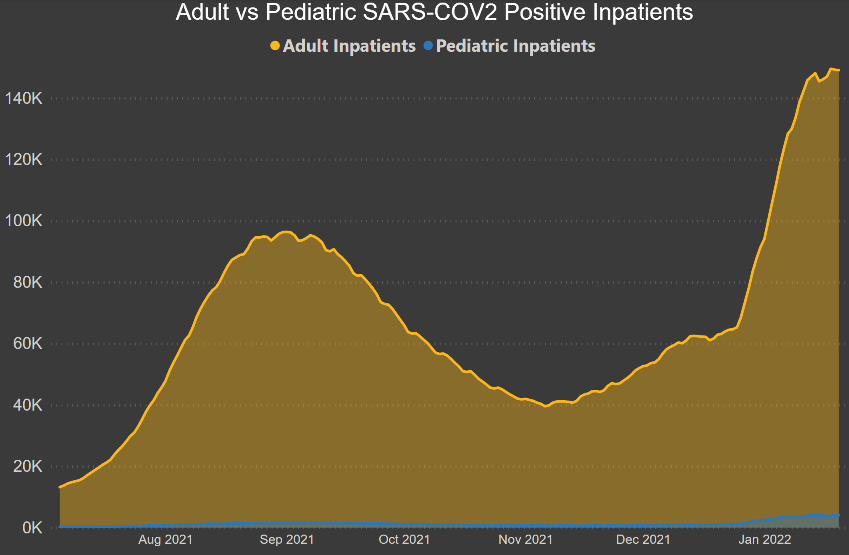
At the request of a subscriber, I have created a dashboard that compares Adult SARS-COV2 Positive Adults Inpatients, vs Pediatric SARS-COV2 Positive Inpatients.
Below is what that looks like for the entire Country as of this writing.
However, we need to put this in perspective to the overall picture of Hospital Capacity. Take a look at the below picture which shows all Staffed beds, all inpatients, along with Covid. How does Covid patient impact the overall topline capacity?
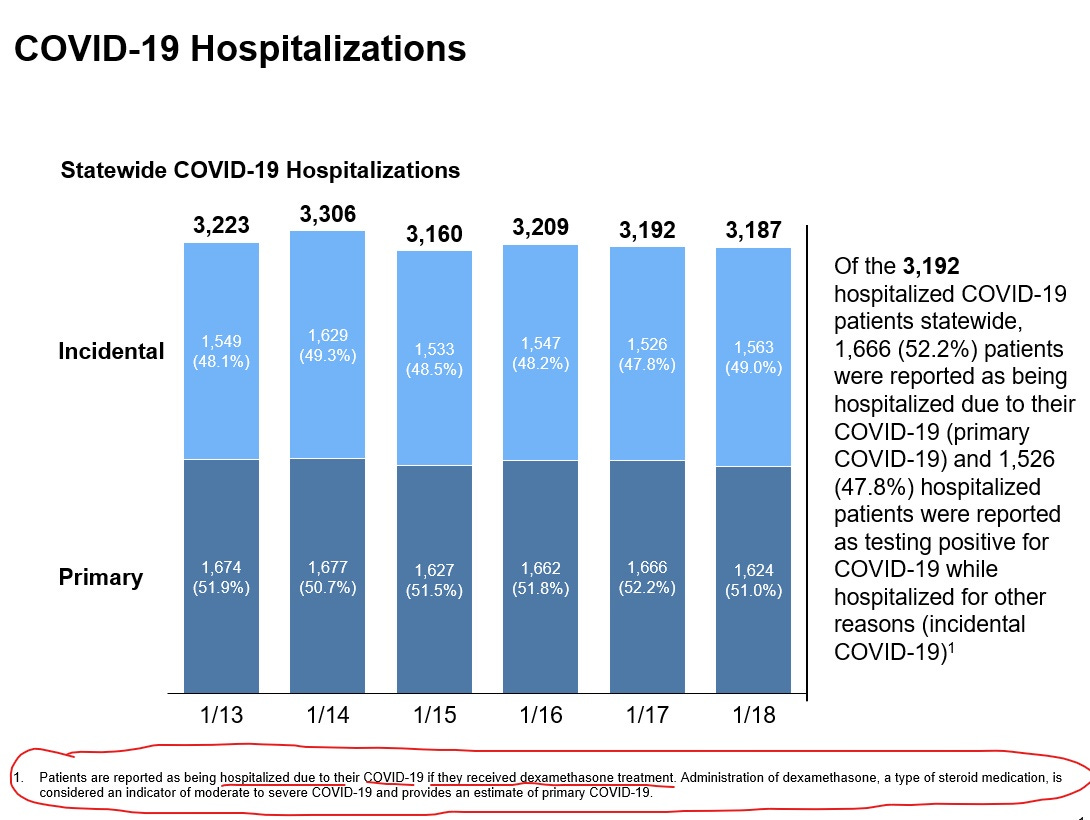
You have probably noticed the intentional title of my Post. I have titled it “SARS-COV2 Positive Inpatients.” This is due to the fact that the data behind the charts above does not tell us whether or not these inpatients are there for or with Covid, only that they have tested positive either upon admission, or were actually admitted for the disease. Massachusetts1 is currently breaking down their hospitalizations by either “Primary” or “Incidental.”
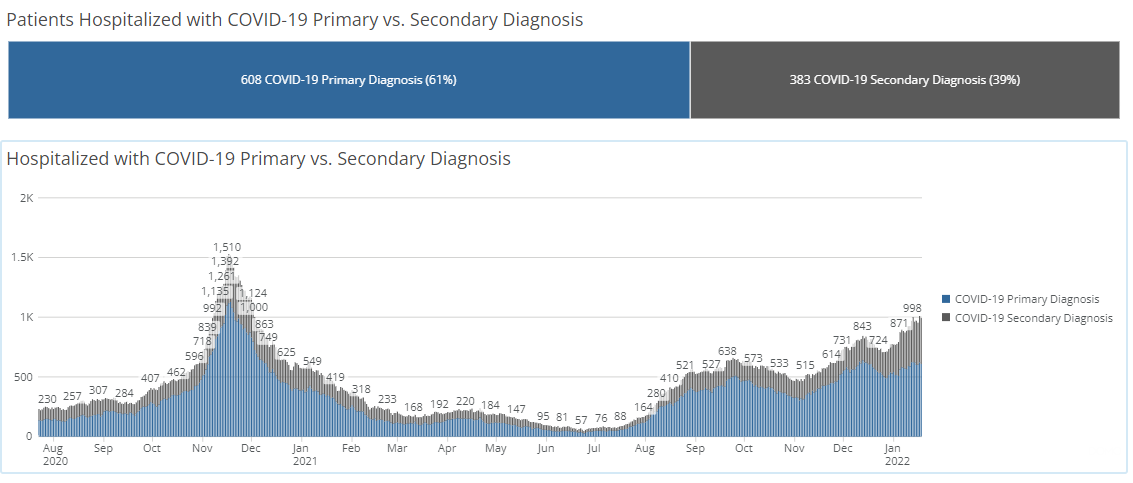
Iowa currently categorizes their hospitalizations2 as “Primary” or “Secondary” Diagnosis.
Currently, the Federal Government is not collecting or reporting this breakdown for the type of Covid hospitalization.
What about kids? When it comes to kids, the issue of over-counting and incidental hospitalizations is actually worse, as they are 5x as likely 3 to have an asymptomatic case of Sars-Cov2 than adults.
A paper in the journal Hospital Pediatrics4 found:
Results: Of 117 hospitalizations, 46 (39.3%) were asymptomatic, 33 (28.2%) had mild to moderate disease, 9 (7.7%) had severe illness, and 15 (12.8%) had critical illness (weighted κ: 0.82). A total of 14 (12%) patients had multisystem inflammatory syndrome in children. A total of 53 (45%) admissions were categorized as unlikely to be caused by SARS-CoV-2 (κ: 0.78)
So while we can get a sense of just how massive the difference is between adults and children, as far as the proportional impact to hospitals, we are still likely over-estimating the impact to kids.
Here’s a sample of what the situation looks like in Connecticut, Idaho, DC, and Tennessee.
Paid subscribers can access the tool below.
Keep reading with a 7-day free trial
Subscribe to Relevant Data to keep reading this post and get 7 days of free access to the full post archives.


