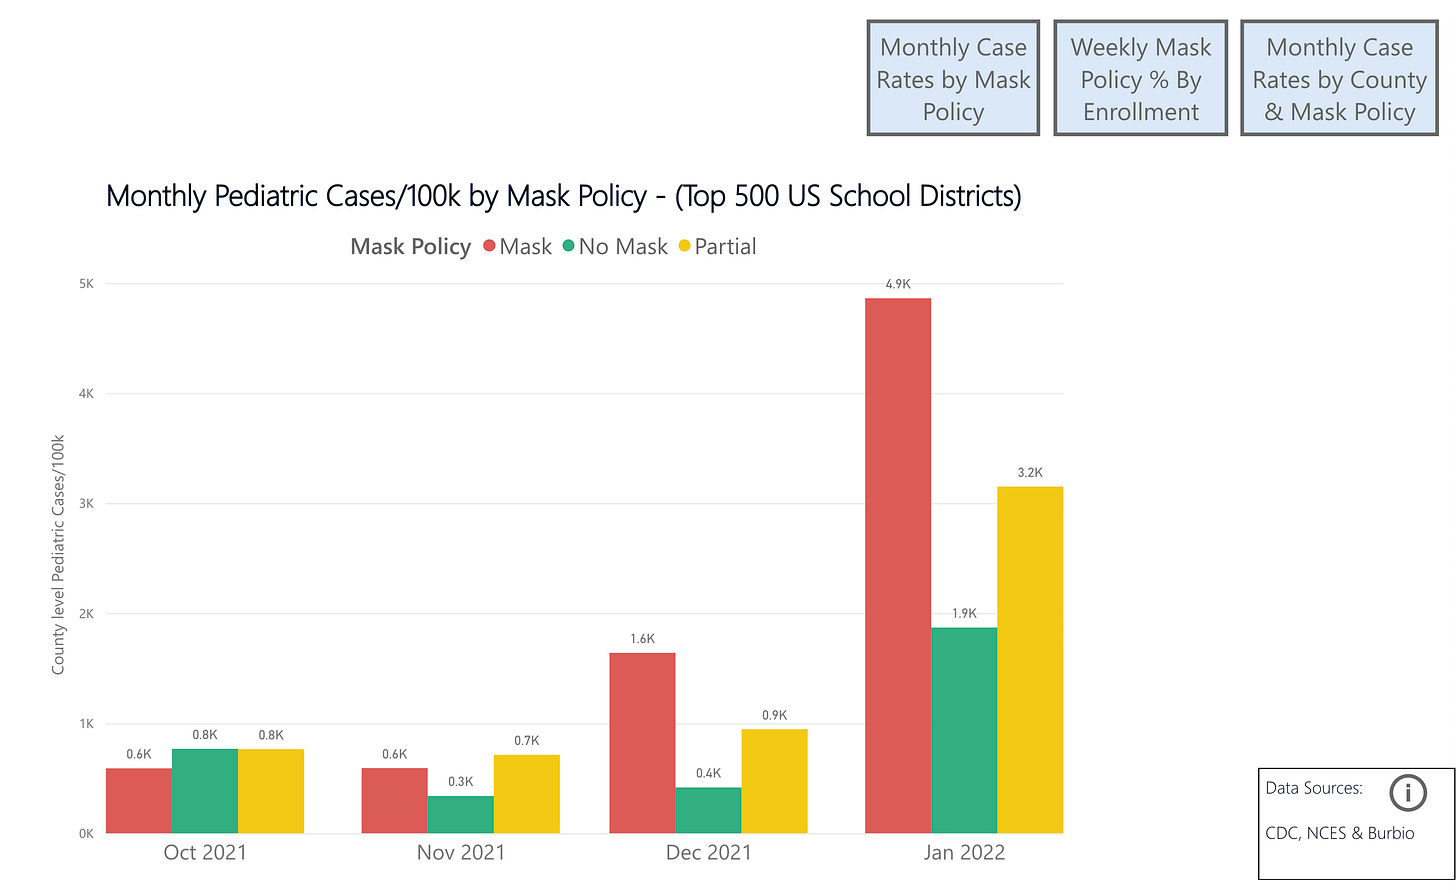
Comparing Case Rates for the Top 500 School Districts by Mask Status, School year 2021/22
Special Cross-Post from Emily Burns
From Relamination, By Emily Burns:
Since the beginning of the 2021-2022 school year, millions of students across the country have been attending school un-masked. You’d think the CDC and others would be curious about the difference between masked districts and un-masked districts. Unfortunately, scientific curiosity is no longer a hallmark of the CDC—particularly as it pertains to children and masks.
But the data are there. And as with so much in this pandemic, they tell a story different from the one the CDC is spinning.
Burbio.com has been tracking weekly mask status for the 500 largest school districts, comprising approximately 40% of the nations ~51 million public school students.
With these data in hand, the question is, “Is there a difference in the case rates between masked and un-masked districts?”
While we don’t have access to district level case rates, we can use the pediatric case rates at the county level as a reasonable proxy for the school case rates, as most children in a given county are in public schools, and most counties tend to be either masked or un-masked, not a mixture.
The result of that analysis is below. As you can see, except for a slight edge in October, masked districts fare 2-4x worse than un-masked districts. Why would that be?
Continue reading at Emily Burn’s substack, here.


